Ground air quality analysis
| 2019 | 33 | 341 |
|---|---|---|
| Reference Year | PM10 max. μg/m3 | NOx max.μg/m3 |
Study on the impact of ground activities
A calculated analysis at Lux Airport of PM10 and NOx for 2019 has been compared with measurements taken in the surrounding environment.
We conducted a ground-based air emissions study, which complements the campaign around the airport carried out by the Environmental Administration with LIST in 2018-2019 to deter-mine the impact of airport activities on the region. In the study, we analyzed the parameters that are most commonly associated with an airport: NOx and particulate matter, especially PM10.
Particulate matter
Particulate matter (PM 10) refers to all particles in the air that are smaller than 10 micrometres. Particulate matter comes from traffic, livestock, combustion processes (e.g. in industry) and natural sources (e.g. sea salt). Primary particulate matter is released directly into the atmosphere by human activities. The part of the particulate matter concentration that is formed in the air is called secondary particulate matter. PM10 is one of the substances that contribute to smog.
For PM10 there is a threshold of 40 µg/m3 as an annual aver-age, which must not be exceeded, and a threshold of 50 µg/m3 as a 24-hour average, which must not be exceeded more than 35 times per year.
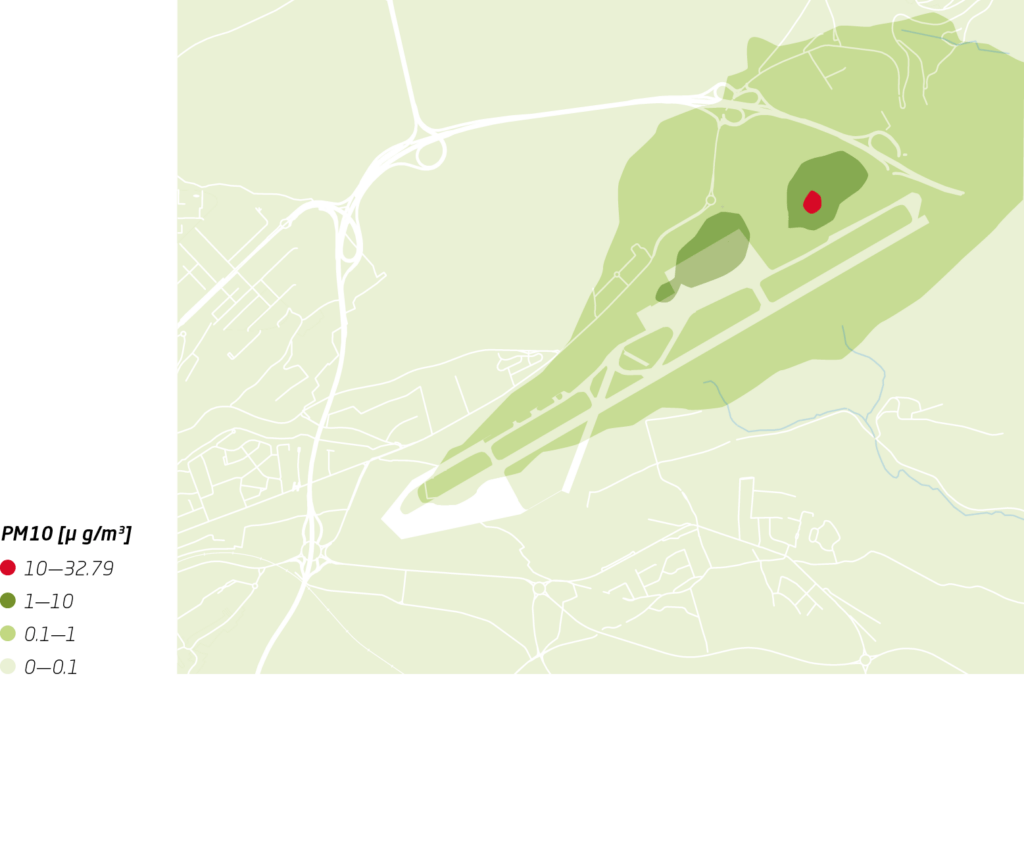
PM10 (annual average)
The calculation was performed for a full year. The highest concentration was found at the centre of the apron cargo with a value of 32.79 μg/m3, which is below the average annual threshold of 40 μg/m3. In general, the highest concentrations were found around the apron (less than 10 μg/m3), followed by the taxiway and runway areas (less than 1 μg/m3) and then rapidly decreasing to less than 0.1 μg/m3 outside the airport perimeter.
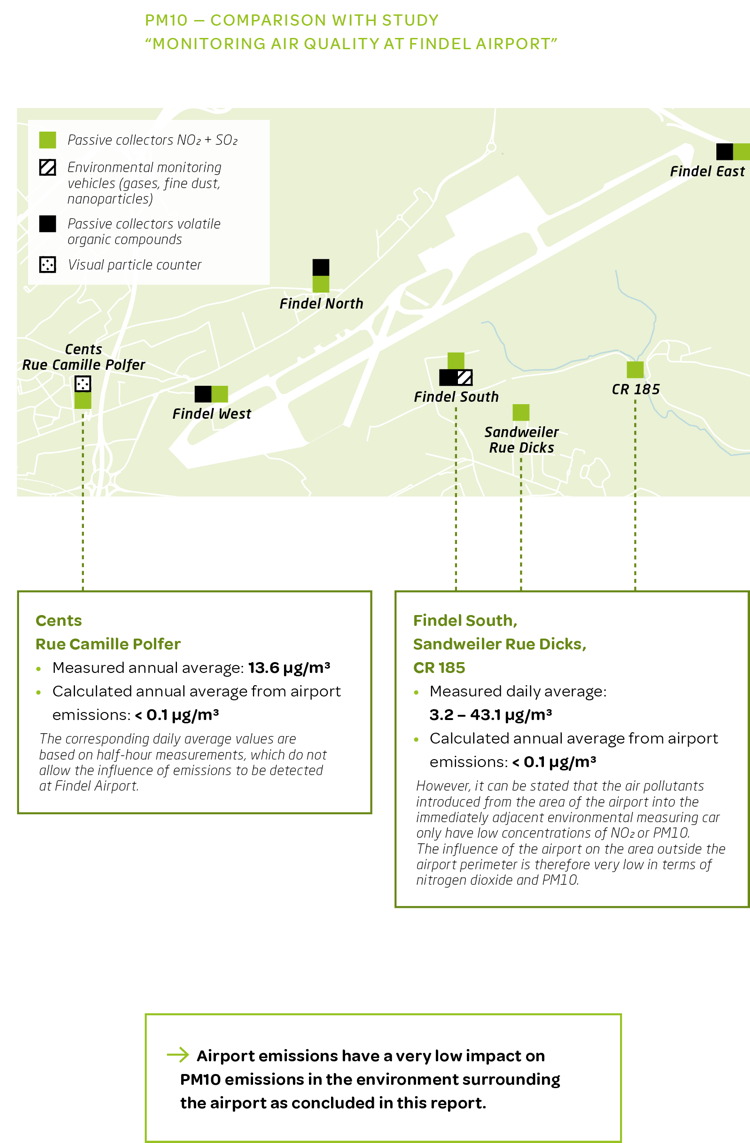
PM10 — Comparison with Study
“Monitoring air quality at findel Airport”
Nitrogen Dioxide
Nitrogen dioxide (NO2) belongs to a group of highly reactive gases known as nitrogen oxides (NOx). ICAO certification measures the total NOx emissions (NOx = NO + NO2). However, the proportion of each component varies depending on the engine and thrust setting (Timko et al., 2010a).
Based on the prevailing conditions in aviation, an average f-NO2 value of 0.15 is recommended for the fraction of NOx emitted as primary NO2 from these sources, except for the taxiing phases, for which a ratio of 1 is used.
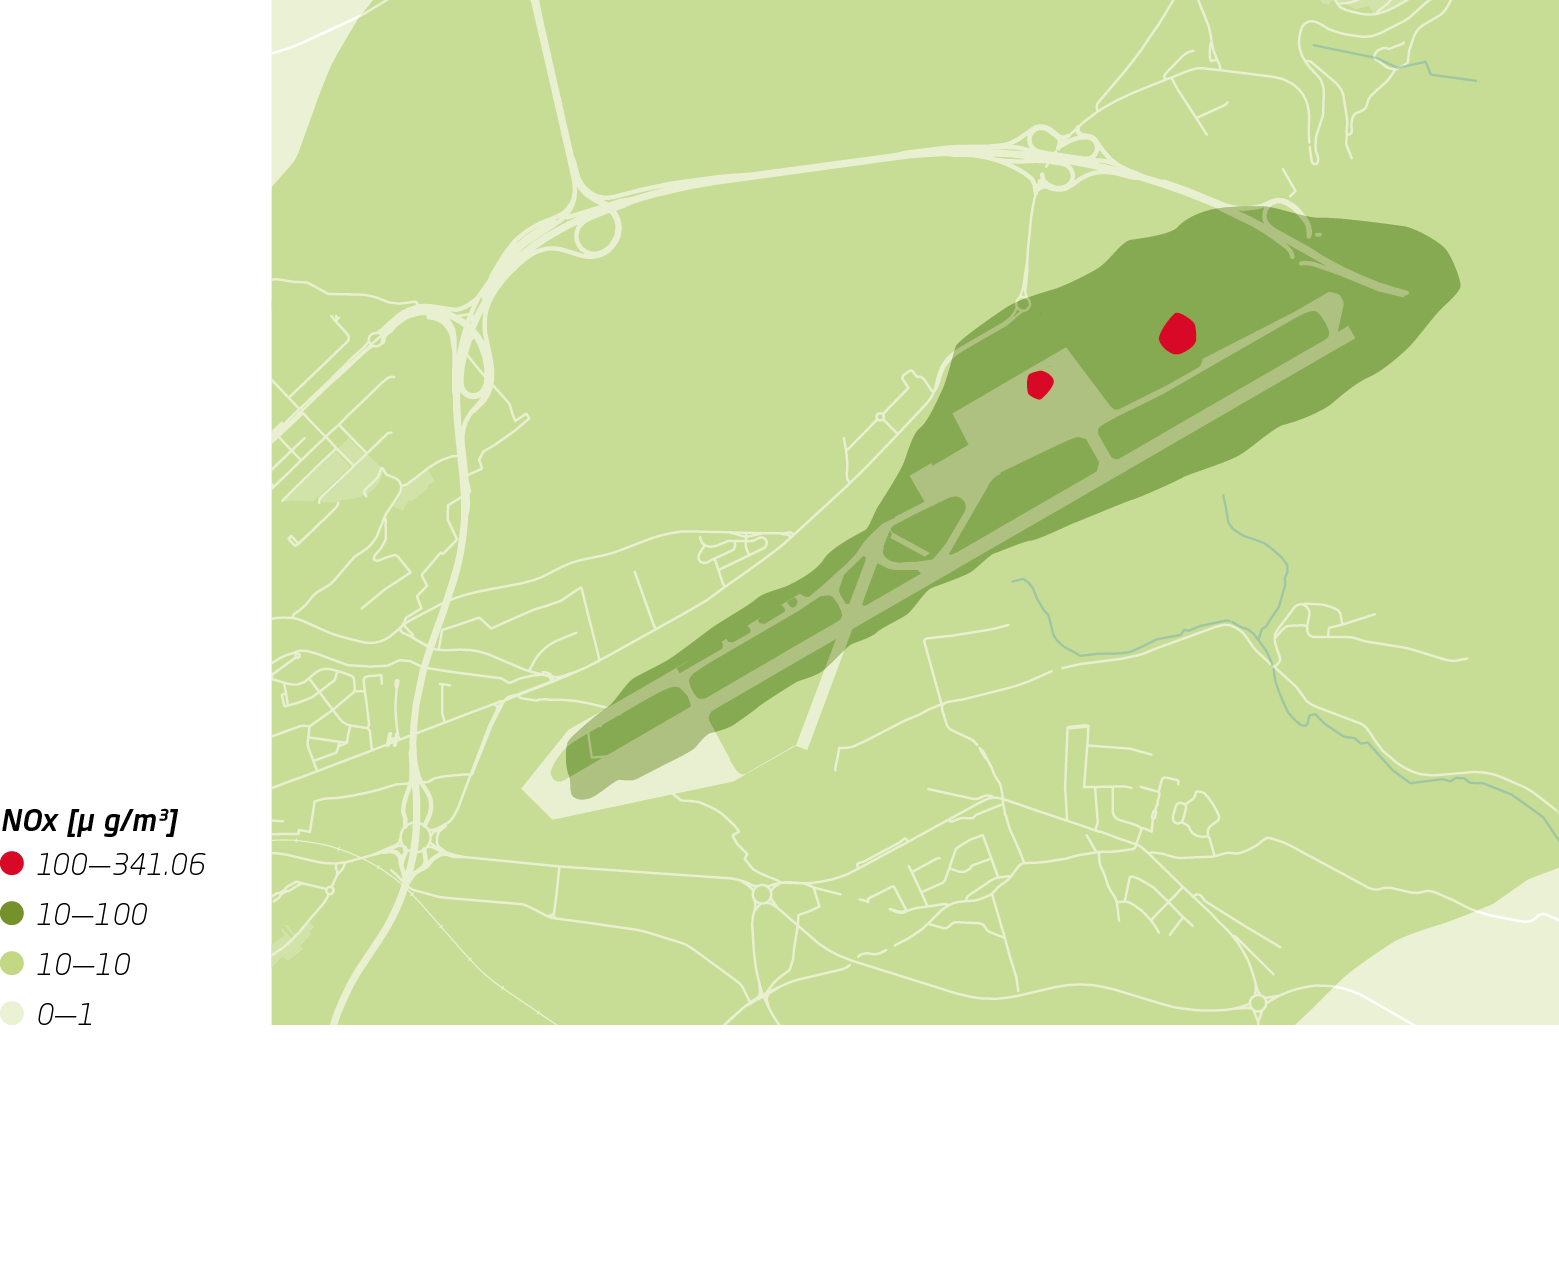
NOx (annual average)
The calculation was performed for a whole year. The highest concentrations were found at two locations in the middle of the apron, both cargo and commercial, with a value of 341.06 μg/m3. This high concentration quickly drops to lower levels.
In general, the highest NOx concentrations were found throughout the airport area with values in the tenths of μg/m3. The area surrounding the airport showed a concentration of less than 10 μg/m3. The level drops to less than 1 μg/m3 at a distance of at least 4 km from the airport (more in the direction of the runway).
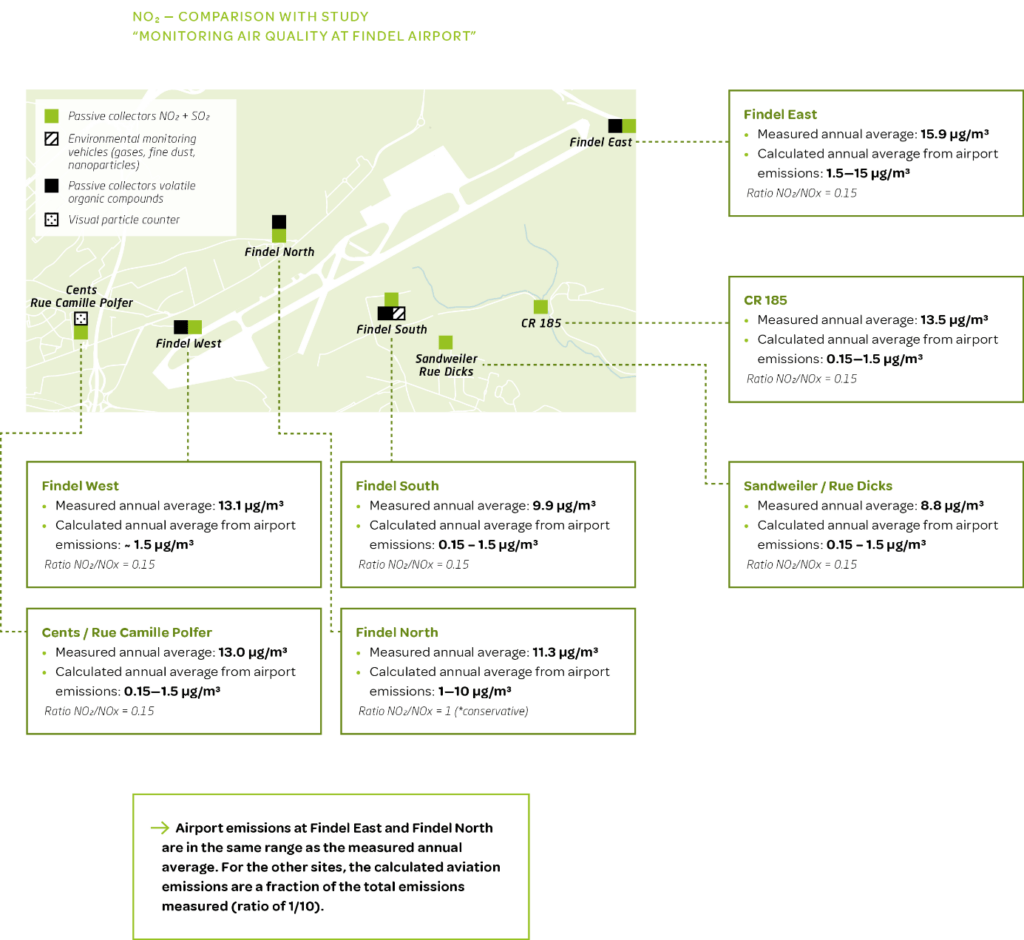
The graph above compares the average concentrations measured between June 2018 and May 2019 near the airport (in green) with the annual averages in 2019 of the NO² continuous measurement stations of the air quality monitoring network (in white). We can deduce that the concentrations around the airport are lower than the concentrations of stations assessing the impact of traffic. The concentrations observed correspond more to a peri-urban, even rural, situation.
Conclusions
The airport’s emissions of particulate matter (PM10) and NOx are centralised inside the airport and dispersion outside is very low. The annual average of the highest concentrations of PM10 remains below the average threshold. The calculation of dispersion of emissions due to ground airport activities shows it to be weak, which confirms the hypotheses and conclusions made in the final report “Monitoring air quality at Findel Airport”.
Air management
Anti-smog
Hydrogen- based technology
air emissions -80%
Solar impulse certified
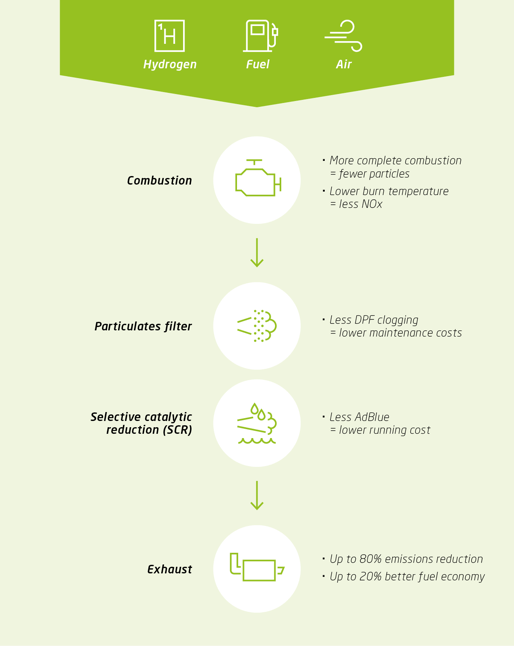
The Anti-smog technology for vehicles is integrated with existing technology in internal combustion engines and acts pre-combustion. In other words, the technology acts before the combustion process takes place. The solution is based on an innovative principle for improving hydrogen fuel. Adding small amounts of hydrogen to the air-fuel mixture helps to reduce exhaust emissions, including particulate matter and NOx. This process has been adapted to allow its implementation on a smaller scale in vehicles.
The process is based on the generation of small amounts of hydrogen onboard the vehicle, using the principle of electrolysis of a water-based potassium electrolyte solution. This small amount of hydrogen is then added to the vehicle’s air-fuel mixture prior to combustion. The hydrogen then allows the fuel to burn more completely, reducing the amount of unburned gases and particles. Unlike filters or selective catalytic reduction, which are post-combustion technologies used today, hydrogen enrichment is a pre-combustion solution, which is at the heart of the proposed innovation.
Pre-combustion technologies
This technology is suitable for diesel engines in vehicles over 5 years old. At lux-Airport, with our commitment to a policy of renewing our fleet according to our roadmap towards neutrality, we do not have this type of vehicle. However, we have decided to install it in one of our mobile diesel masts, which illuminate certain areas of the aircraft parking aprons. This will allow us to compare its impact with that of an un-equipped mobile mast during the test phase. Depending on the results, we will extend this to all of our mobile masts and encourage the use of this technology in the ground support equipment of our stakeholders. Through this initiative, we hope to reduce emissions by up to 80% and fuel consumption by up to 20%.